Visualizers
The spectrogram, showing frequency content over time.
Waveform
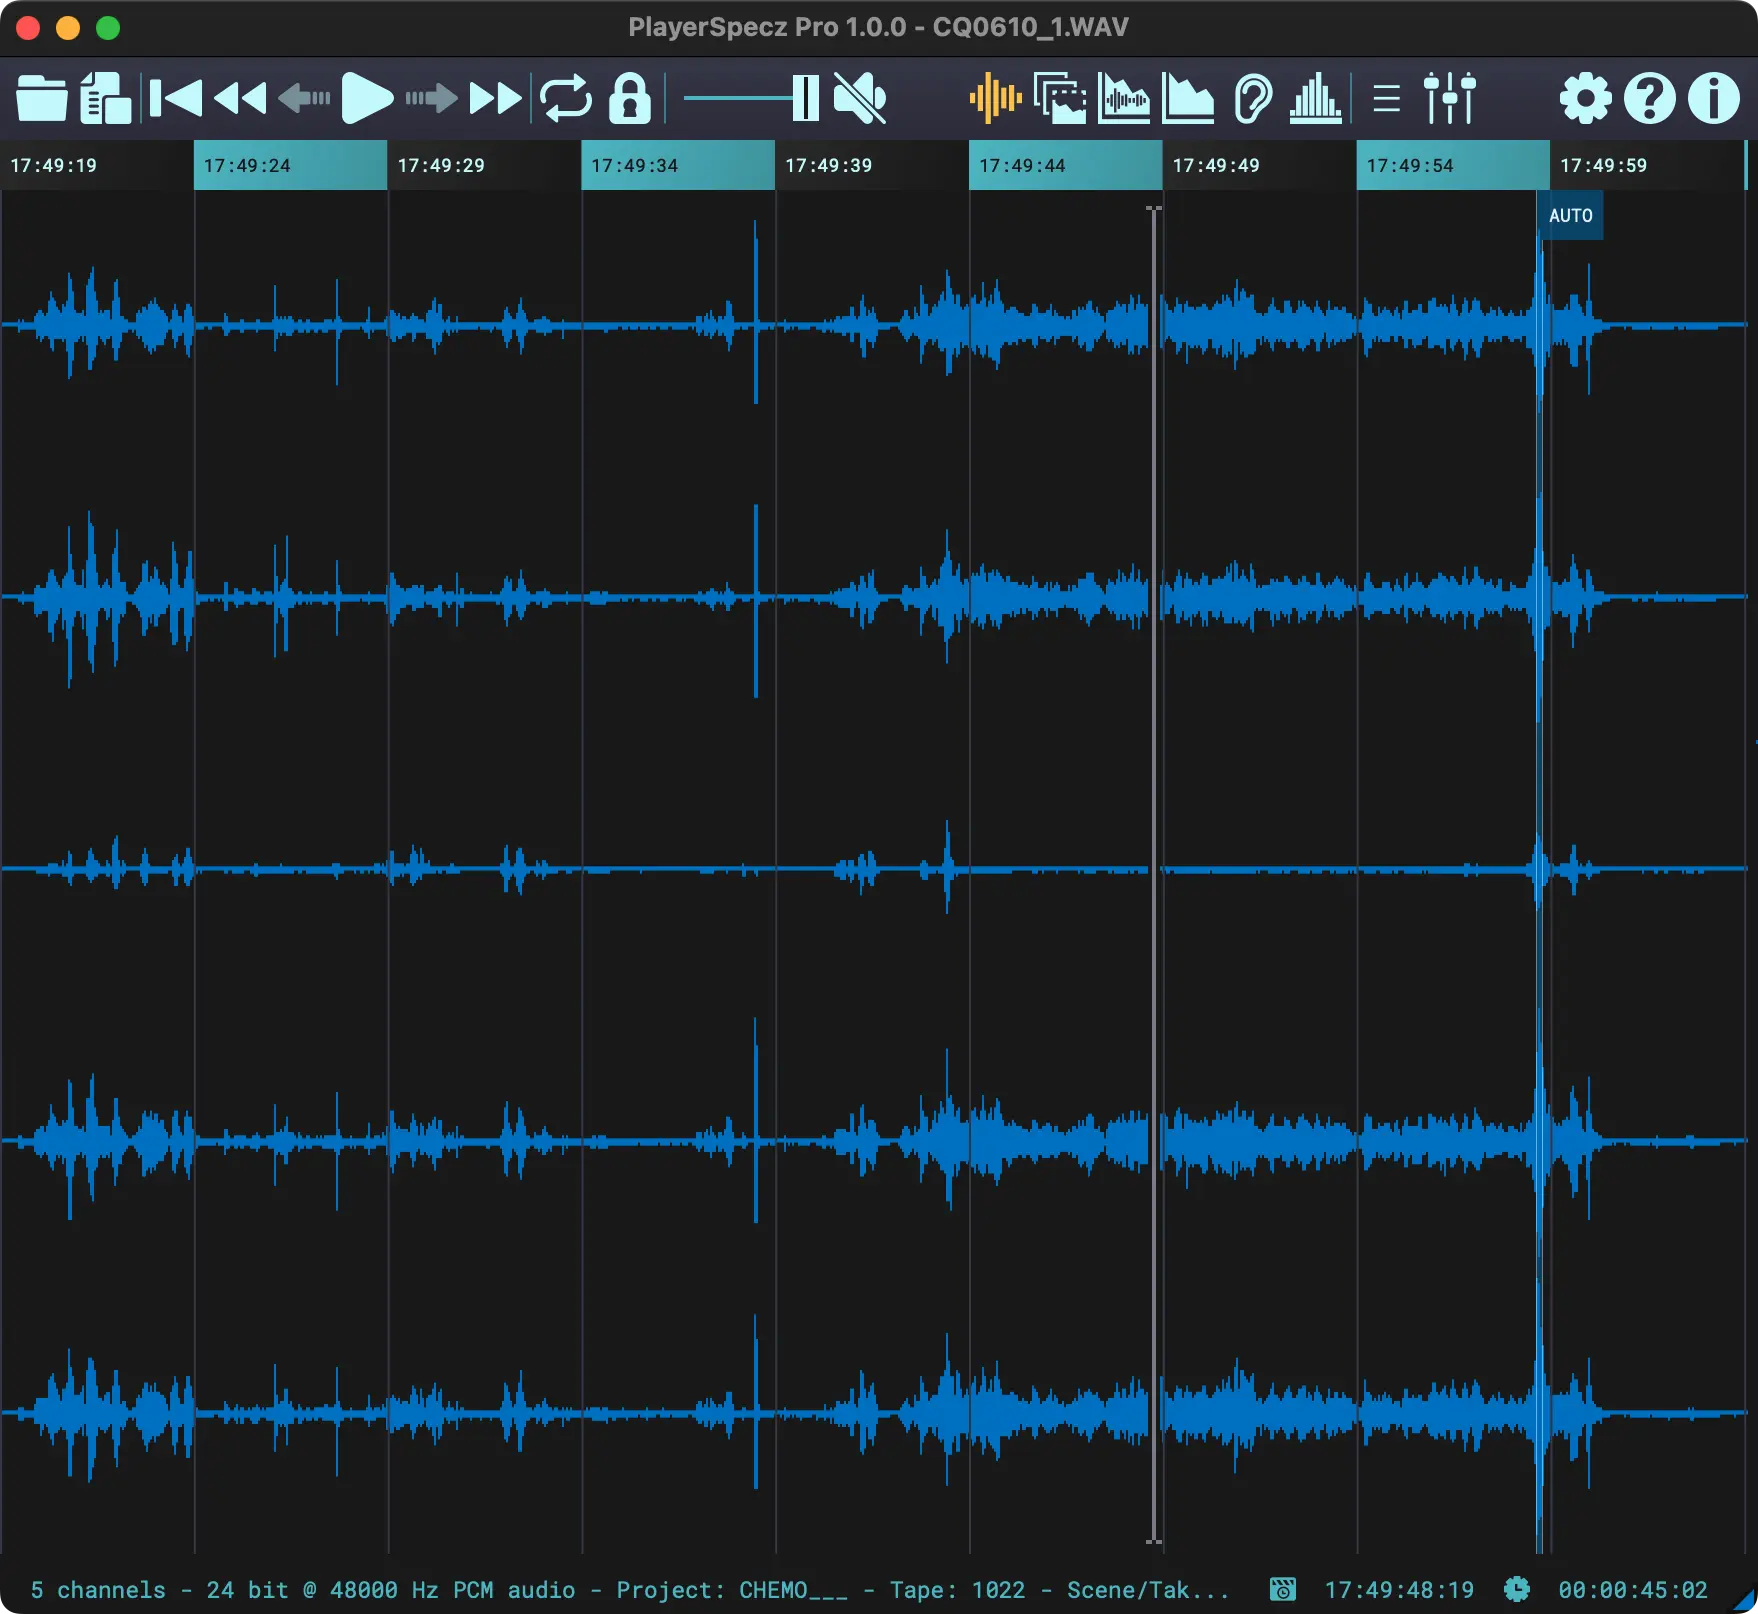
The main view, which is also present in the free version, is the waveform view.
This view if fully zoomable, up to individual sample level, enabling you to quickly find the section you are looking for.
Any cues, markers or loops embedded within the audio data are shown (like the AUTO marker in the example to the right). Channel names, when present in the metadata, will be displayed on the relevant channel. On top there is a time ruler, which you can drag to move the window around. This ruler as well as the grid lines can be disabled if required, creating a very minimalistic interface.
Clicking or dragging the mouse will set the playback position.
Spectrogram
The fully zoomable spectrogram view enables you to see the frequency content over time.

Spectrogram view.
Spectrogram settings.
Vertical scale.
FFT windowing type.
Spectrogram quality.
Spectrogram color palette.
Spectrogram gain.
Re-calculate spectrogram.
Cursor frequency.

The main spectrogram view.

Hover over the cog wheel to show the spectrogram settings.

Set the horizontal scale:
- Linear
- Logarithmic
- Bark
The Bark scale is especially useful to check low frequency content.

There are several windowing methods you can use to gather the frequency data. Choices are rectangular, triangular, Hann, Hamming, Blackman, Blackman-Harris, FlatTop and Kaiser.

Three different quality levels can be set here. Higher levels give more resolution, but take longer to compute.


The spectrogram gain (brightness) can be adjusted with this slider.

Re-calculate the spectrogram.

Here you see the frequency where the mouse cursor is currently hovering.
Mixed Spectrogram and Waveform
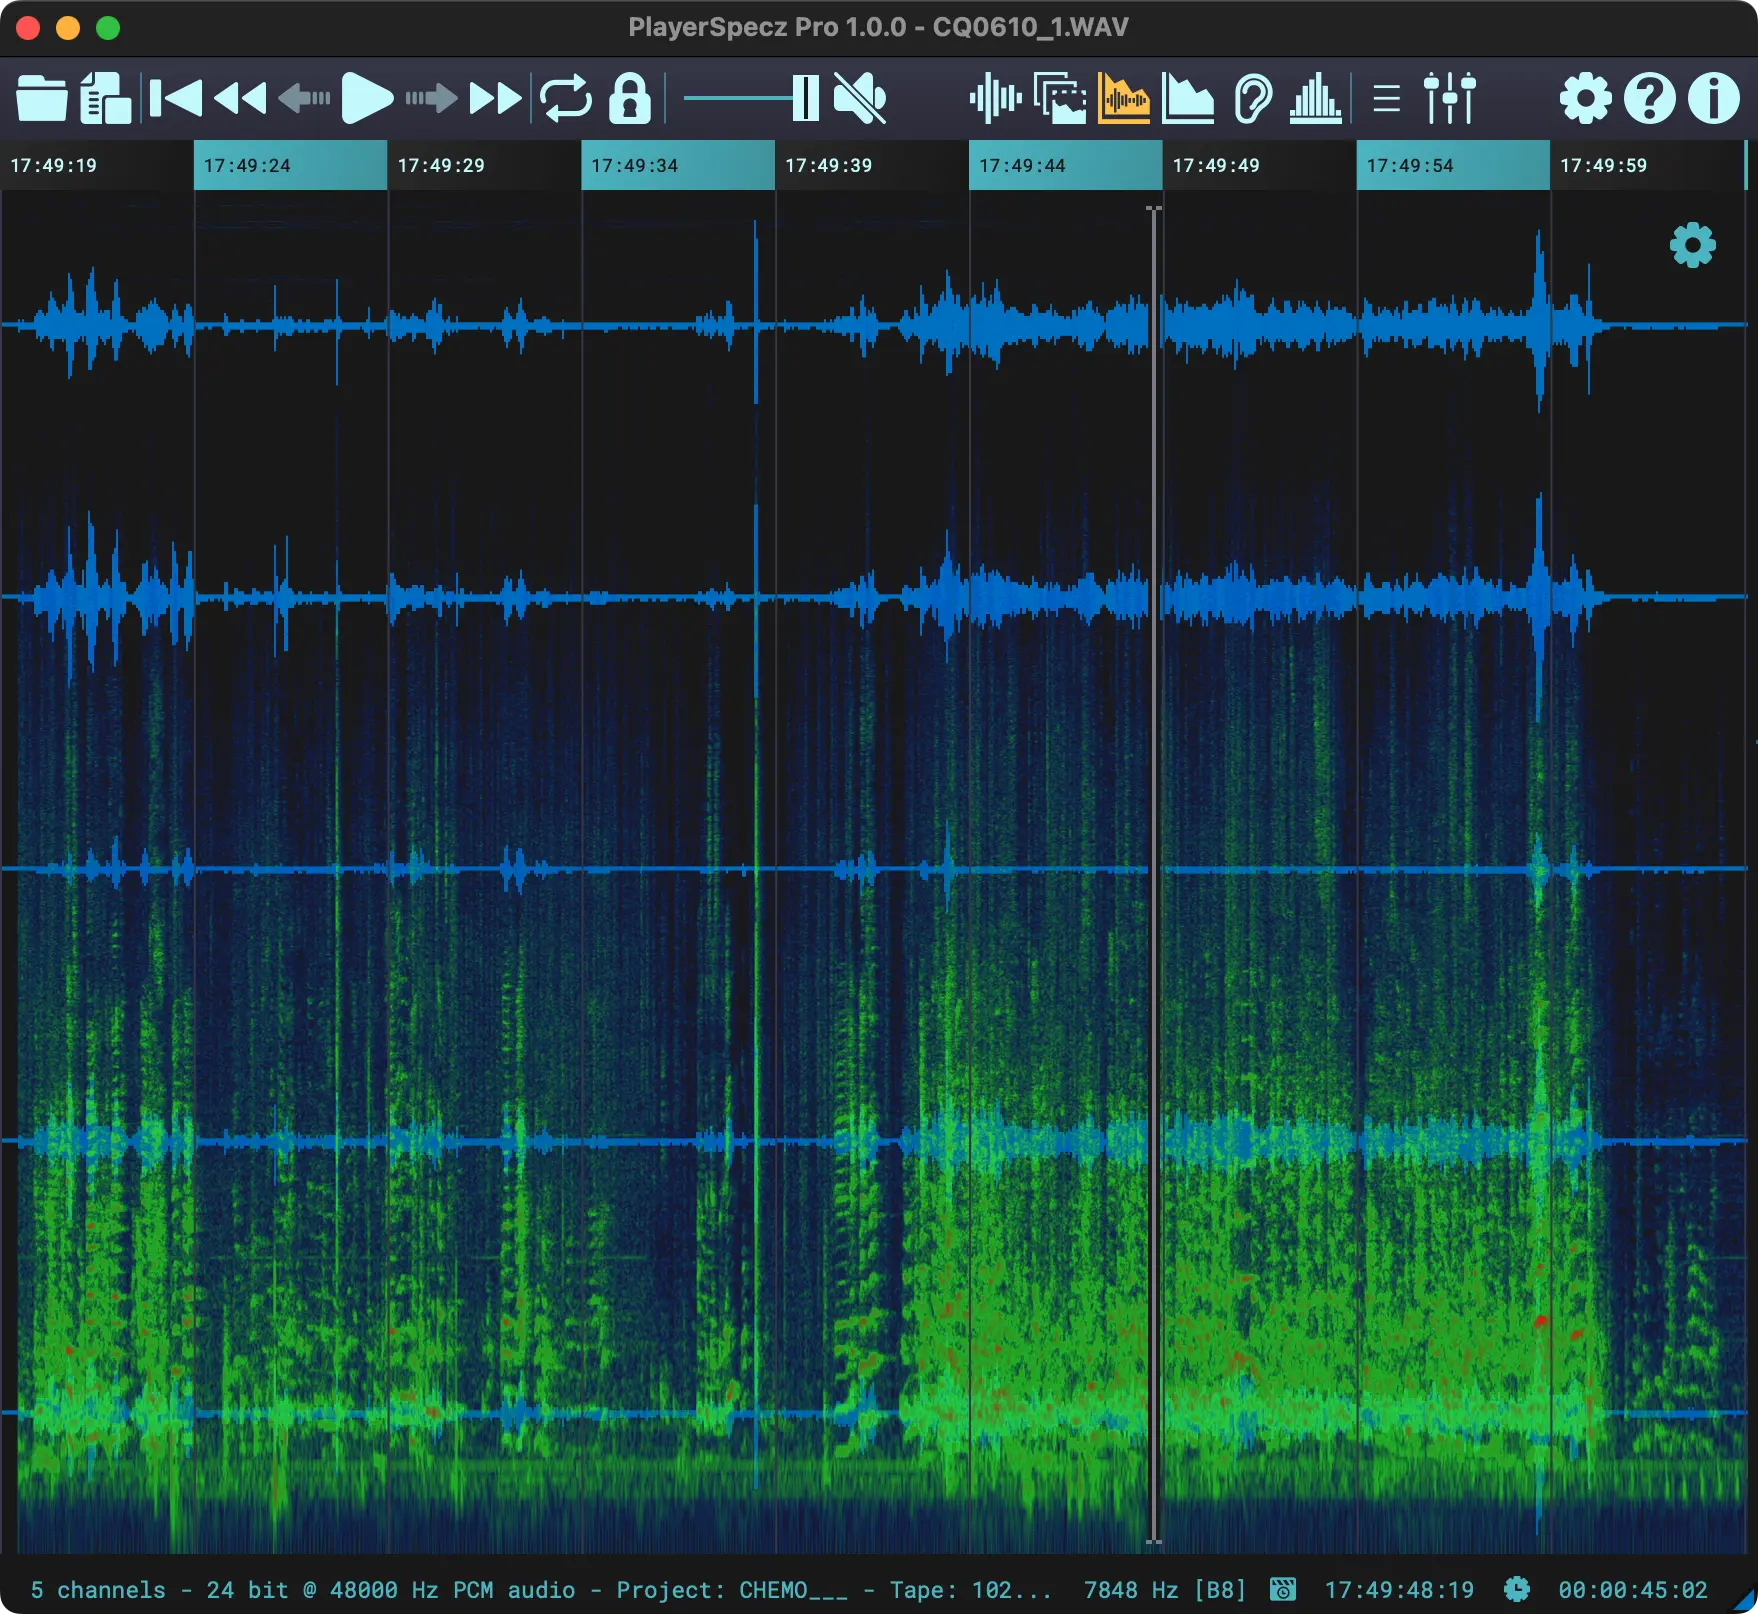
In this view, conveniently, the waveform and spectrogram view have been overlaid on each other.
You retain the ability to zoom in fully and use it just like you would the waveform.
Also the same controls available on the spectrogram view (accessible via the cog wheel) are present here to customize.
Real-time Spectrum Analyzer
The real-time spectrum analyzer gives you a continuous display of the frequency content of the audio signal. Use it to quickly find resonances or other areas of interest.
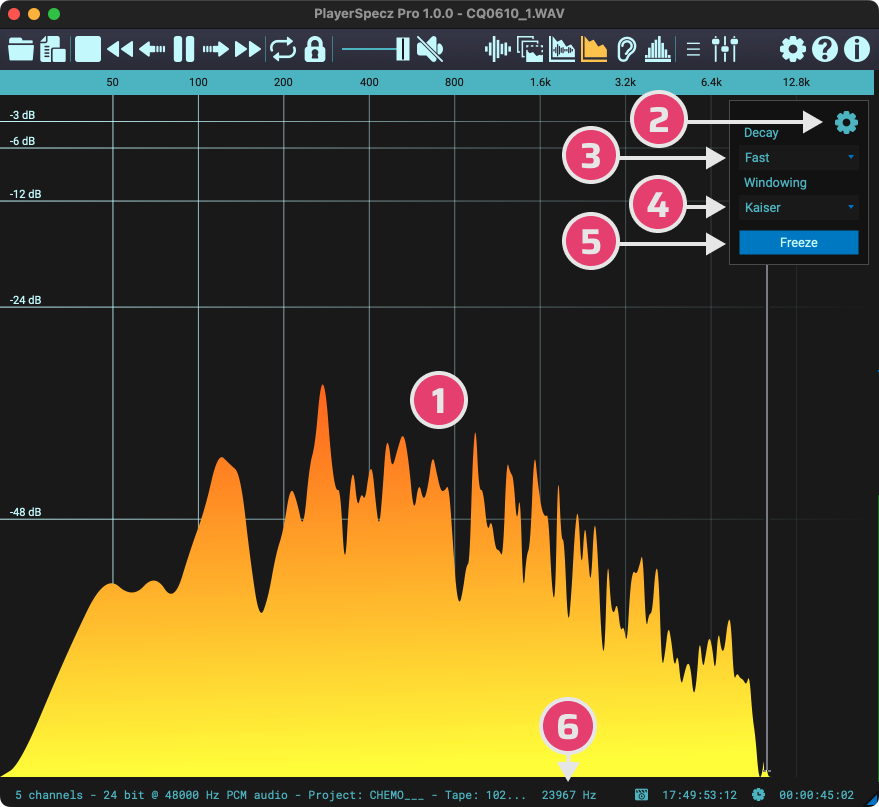
Spectrum analyzer view.
Spectrum analyzer settings.
Spectrum decay speed.
FFT windowing type.
Freeze/pause analyzer.
Cursor frequency.

The main view of the spectrum analyzer.

Hover over the cog wheel to show the settings of the spectrum analyzer.

Set the decay time (amount of averaging) to fast or slow.

There are several windowing methods you can use to gather the frequency data. Choices are rectangular, triangular, Hann, Hamming, Blackman, Blackman-Harris, FlatTop and Kaiser.

You can freeze/pause the spectrum analyzer, to inspect a certain moment and then click again to un-freeze and continue analyzing.

Here you see the frequency where the mouse cursor is currently hovering.
Loudness History
Here you can see the loudness history of your audio material, compliant with the EBU R.128 and ITU-R BS.1770 standards. The view is also fully zoomable to be able to inspect key moments in more detail.
All three loudness curves are available (momentary, short term and integrated), as well as the loudness range max and relative gate levels.

The main, fully zoomable, loudness view.

Hover over the cog wheel to show the loudness settings.

Select which loudness graph to show:
- momentary
- short-term
- both
Momentary has the shortest window and thus reacts the quickest to changes, while short-term is longer and slower to react.

Show the integrated loudness level. This is the ‘total’ loudness value of the whole audio file, displayed in LUFS.

Show or hide the loudness zones. This includes the relative gate level (values below this level are not part of the integrated loudness) and the max loudness range level used to calculate the LRA (see also loudness distribution).
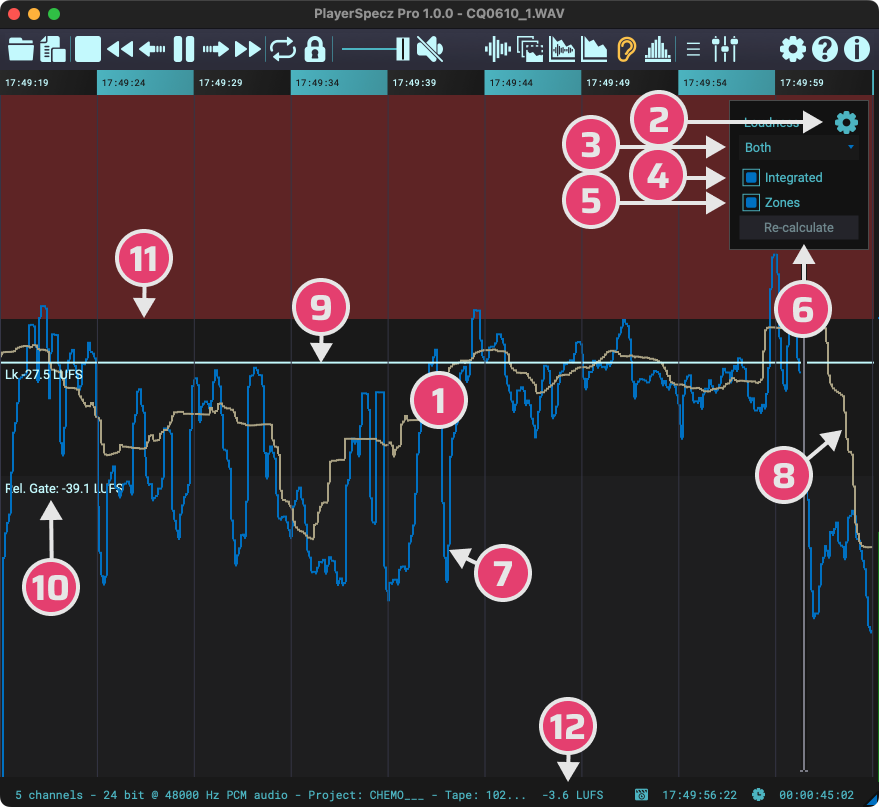
Loudness view.
Loudness settings.
Show/hide loudness graphs.
Show/hide integrated loudness.
Show/hide loudness zones.
Re-calculate loudness.
Momentary loudness.
Short-term loudness.
Integrated loudness.
Relative gate level.
Max. LRA level.
Cursor loudness.

Re-calculate the loudness graphs.

The momentary loudness graph.

The short-term loudness graph.

The integrated loudness level. This is what is referred to as the loudness of the complete audio file.

The relative gate level (loudness values below this level are not used to calculate the integrated loudness).

This is the max loudness range level used to calculate the LRA (see also loudness distribution).

Here you see the loudness value (in LUFS) where the mouse cursor is currently hovering.
Loudness Distribution
This view, in particular, is very useful in determining the dynamics of your audio. Quickly see the loudness range you are using and the available headroom.
Every bar in this graph represents a loudness value. The higher the bar, the more moments with this loudness are present in the audio file.
Basically a histogram for audio.
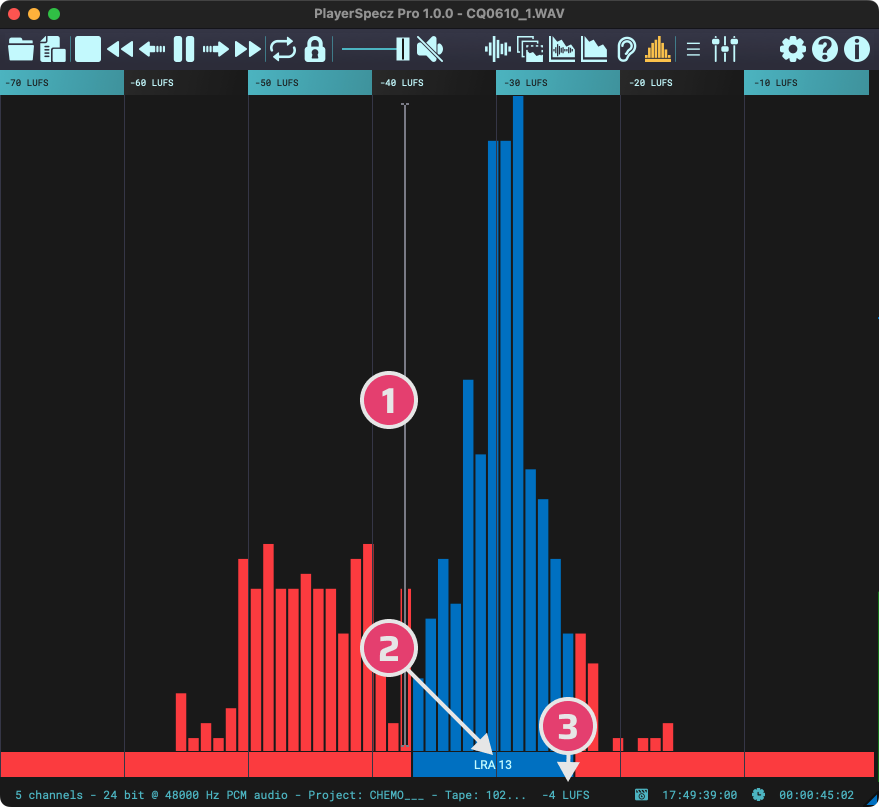
Distribution view.
Current loudness range (LRA).
Cursor loudness.

The loudness distribution view.

Hover over the cog wheel to show the loudness settings.

Select which loudness graph to show:
- momentary
- short-term
- both
Momentary has the shortest window and thus reacts the quickest to changes, while short-term is longer and slower to react.

